
Page 161 - Mathematics GRADE 9, DE-STREAMED (MTH1W)
P. 161
• revisit learning from earlier grades related to the graphical representations of data involving a single variable, such as histograms, stem-and-leaf plots, circle graphs, and various types of bar graphs, and distinguish between discrete and continuous data;
• support students in understanding the differences in the measures of central tendency and knowing when each one might be appropriate;
• continue to support students in developing their proportional reasoning skills, including the use of appropriate scaling in their representations;
• support students in expanding their communicative repertoire to include a broader range of related terminology and conventions, particularly for English language learners.
Teacher Prompts
• How do you identify quartile values?
• What steps do you follow to create a box plot?
• When do you use a box plot to represent data?
• How do you know which data values might be outliers?
• What information does a box plot show that a histogram does not?
• What information does a stem-and-leaf plot show that a box plot does not?
Sample Tasks
1. Have students represent the CO2 emissions in metric tons per capita from countries with populations of more than 20 million, using appropriate graphical and numerical representations.
2. Have students describe the shape, centre, and spread of the distribution of the number of cyclones formed over the Atlantic basin over the last 50 years, and any outliers.
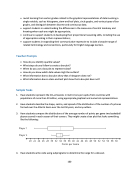
3. Have students compare the distributions of the average number of points per game two basketball players scored in each season of their careers. They might create a box plot that looks something like the following:
4. Have students write code using subprograms to determine the range for a data set. 160
