
Page 160 - Mathematics GRADE 9, DE-STREAMED (MTH1W)
P. 160
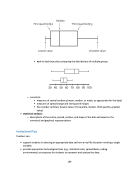
       ▪ back-to-back box plots comparing the distributions of multiple groups:
     o numerical:
▪ measures of central tendency (mean, median, or mode, as appropriate for the data) ▪ measures of spread (range and interquartile range)
▪ five-number summary (lowest value, first quartile, median, third quartile, greatest
value)
• statistical analysis:
o descriptions of the centre, spread, outliers, and shape of the data set based on the
numerical and graphical representations
Instructional Tips
Teachers can:
• support students in selecting an appropriate data set from a real-life situation involving a single variable;
• provide appropriate technological tools (e.g., statistical tools, spreadsheets, coding environments) as necessary for students to represent and analyse the data;
159
