
Page 163 - Mathematics GRADE 9, DE-STREAMED (MTH1W)
P. 163
main program
range = 0.00
run subprogram findMaximum
run subprogram findMinimum
range = maximum - minimum
output “The range of the set of values is,” range
Pseudocode does not represent a specific programming language. It can be adapted to work with a variety of programming languages and/or environments.
D1.3 Representation and Analysis of Data
create a scatter plot to represent the relationship between two variables, determine the correlation between these variables by testing different regression models using technology, and use a model to make predictions when appropriate
Teacher supports
Examples
• two variables with relationships:
o the fuel consumption of a car and its speed
o the amount of saturated fats (in grams) and the number of calories in different granola
bars
o the amount of money borrowed and the interest rate that is offered o the size of the labour force and the employment rate
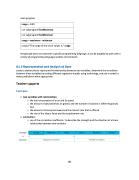
• correlation:
o use of the correlation coefficient r to describe the strength and the direction of a linear
relationship between two variables
Strength Strong Moderate Weak Weak Moderate Strong
r = -1 0 1
Direction Negative Correlation
Positive Correlation
162
