
Page 180 - THE ONTARIO CURRICULUM, GRADES 9 AND 10 | Canadian and World Studies
P. 180
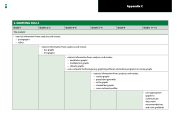
        2. GRAPHING SKILLS
     Grades 11–12
       The student:
  • extracts information from, analyses, and creates: − pictographs
− tallies
           • extracts information from, analyses, and creates:
− bar graphs
− line graphs
    • extracts information from, analyses, and creates:
• uses computer technology (e .g ., graphing software and online programs) to create graphs
− multiple line graphs
− double bar graphs
− climate graphs
  • extracts information from, analyses, and creates:
− population pyramids
− scatter graphs
− circle graphs
− stacked bar graphs
− cross-sectional profiles
   • usesappropriate communicate graphs to
data, make
recommendations,
and solve problems
   Grade 9
      Grades 7–8
       Grades 4–6
       Grades 2–3
      Grade 1
      Appendix C
  178
