
Page 154 - Mathematics GRADE 9, DE-STREAMED (MTH1W)
P. 154
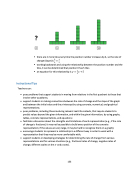
 ▪ there are 2 more tiles every time the position number increases by 4, so the rate of change (slope) is 2 = 1
42
▪ working backwards and using the relationship between the position number and the tiles, it can be determined that position 0 has 5 tiles
▪ an equation for this relationship is y = 1 x + 5 2
Instructional Tips
Teachers can:
• pose problems that support students in moving from relations in the first quadrant to those that involve other quadrants;
• support students in making connections between the rate of change and the slope of the graph and between the initial value and the y-intercept by using concrete, numerical, and graphical representations;
• pose problems, including those involving relevant real-life contexts, that require students to predict values beyond the given information, and within the given information, by using graphs, tables, concrete representations, and equations;
• facilitate a discussion about the strengths and limitations of each representation (e.g., if the rate of change is fractional, it may not be possible to build every position of the concrete representation; if the values are very large, it may be hard to recognize them on a graph);
• encourage students to represent a relationship in a different way in order to work with a representation that they may be more comfortable with;
• support students in developing strategies for determining the rate of change from various representations and for various situations (e.g., fractional rates of change, negative rates of change, different scales on the x- and y-axes).
153
