
Page 151 - The Ontario Curriculum, Grades 11 and 12: Mathematics, 2007
P. 151
A. REASONING WITH DATA OVERALL EXPECTATIONS
By the end of this course, students will:
SPECIFIC EXPECTATIONS
1. Interpreting and Displaying Data
By the end of this course, students will:
1.1 read and interpret graphs (e.g., bar graph, broken-line graph, histogram) obtained from various sources (e.g., newspapers, magazines, Statistics Canada website)
1.2 explain the distinction between the terms population and sample, describe the character- istics of a good sample, and explain why sampling is necessary (e.g., time, cost, or physical constraints)
Sample problem: What are some factors that
a manufacturer should consider when deter- mining whether to test a sample or the entire population to ensure the quality of a product?
1.3 collect categorical data from primary sources, through experimentation involving observation (e.g., by tracking food orders in restaurants offering healthy food options) or measurement, or from secondary sources (e.g., Internet data- bases, newspapers, magazines), and organize and store the data using a variety of tools (e.g., spreadsheets, dynamic statistical software)
Sample problem: Observe cars that pass through a nearby intersection. Collect data on seatbelt usage or the number of passengers per car.
1.4 represent categorical data by constructing graphs (e.g., bar graph, broken-line graph, circle graph) using a variety of tools (e.g., dynamic statistical software, graphing calculator, spreadsheet)
1.5 make inferences based on the graphical repre- sentation of data (e.g., an inference about a sample from the graphical representation of
a population), and justify conclusions orally or in writing using convincing arguments (e.g., by showing that it is reasonable to assume that a sample is representative of
a population)
1.6 make and justify conclusions about a topic of personal interest by collecting, organizing (e.g., using spreadsheets), representing (e.g., using graphs), and making inferences from categorical data from primary sources (i.e., collected through measurement or observa- tion) or secondary sources (e.g., electronic data from databases such as E-STAT, data from newspapers or magazines)
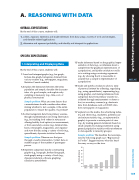
1.7 explain how the media, the advertising indus- try, and others (e.g., marketers, pollsters) use and misuse statistics (e.g., as represented in graphs) to promote a certain point of view (e.g., by making general statements based on small samples; by making statements using general population statistics without reference to data specific to minority groups)
Sample problem: The headline that accompa- nies the following graph says “Big Increase in Profits”. Suggest reasons why this head- line may or may not be true.
1. collect, organize, represent, and make inferences from data using a variety of tools and strategies, and describe related applications;
2. determine and represent probability, and identify and interpret its applications.
Profits ($ billions)
23 22 21 20 19 18
17 2001
2002 2003 2004
2005 2006 2007
Year
REASONING WITH DATA
149
Mathematics for Work and Everyday Life
MEL4E
