
Page 147 - The Ontario Curriculum, Grades 11 and 12: Mathematics, 2007
P. 147
between the two variables (i.e., by describing the type of correlation as positive, negative, or none; by describing the strength as strong or weak; by examining the context to determine whether a linear relationship is reasonable)
1.8 make conclusions from the analysis of two- variable data (e.g., by using a correlation to suggest a possible cause-and-effect relation- ship), and judge the reasonableness of the conclusions (e.g., by assessing the strength of the correlation; by considering if there are enough data)
2. Applying Data Management
By the end of this course, students will:
2.1 recognize and interpret common statistical terms (e.g., percentile, quartile) and expres- sions (e.g., accurate 19 times out of 20) used in the media (e.g., television, Internet, radio, newspapers)
2.2 describe examples of indices used by the media (e.g., consumer price index, S&P/TSX composite index, new housing price index) and solve problems by interpreting and using indices (e.g., by using the consumer price index to calculate the annual inflation rate)
Sample problem: Use the new housing price index on E-STAT to track the cost of purchas- ing a new home over the past 10 years in the Toronto area, and compare with the cost in Calgary, Charlottetown, and Vancouver over the same period. Predict how much a new home that today costs $200 000 in each of these cities will cost in 5 years.
2.3 interpret statistics presented in the media (e.g., the UN’s finding that 2% of the world’s population has more than half the world’s wealth, whereas half the world’s population has only 1% of the world’s wealth), and
explain how the media, the advertising indus- try, and others (e.g., marketers, pollsters) use and misuse statistics (e.g., as represented in graphs) to promote a certain point of view (e.g., by making a general statement based
on a weak correlation or an assumed cause- and-effect relationship; by starting the vertical scale on a graph at a value other than zero; by making statements using general population statistics without reference to data specific to minority groups)
2.4 assess the validity of conclusions presented in the media by examining sources of data, including Internet sources (i.e., to determine whether they are authoritative, reliable, unbiased, and current), methods of data collection, and possible sources of bias (e.g., sampling bias, non-response bias, a bias in a survey question), and by questioning the analysis of the data (e.g., whether there is any indication of the sample size in the analysis) and conclusions drawn from the data (e.g., whether any assumptions are made about cause and effect)
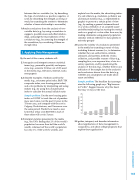
Sample problem: The headline that accompa- nies the following graph says “Big Increase in Profits”. Suggest reasons why this head- line may or may not be true.
23 22 21 Profits ($ billions) 20 19 18
17 2001
2002 2003 2004
2005 2006 2007
Year
2.5 gather, interpret, and describe information about applications of data management in occupations, and about college programs that explore these applications
DATA MANAGEMENT
145
Foundations for College Mathematics
MAP4C
