
Page 123 - The Ontario Curriculum, Grades 11 and 12: Mathematics, 2007
P. 123
as a measure of the fit of the data to a linear model, and determine, using technology, the relevant numerical summaries (e.g., summary tables such as contingency tables; correlation coefficients)
Sample problem: Organize data from Statistics Canada to analyse gender differences (e.g., using contingency tables; using correlation coefficients) related to a specific set of charac- teristics (e.g., average income, hours of unpaid housework).
2.2 recognize and distinguish different types of relationships between two variables that have a mathematical correlation (e.g., the cause- and-effect relationship between the age of a tree and its diameter; the common-cause rela- tionship between ice cream sales and forest fires over the course of a year; the accidental relationship between the consumer price index and the number of known planets in the universe)
2.3 generate, using technology, the relevant graphical summaries of two-variable data (e.g., scatter plots, side-by-side boxplots) based on the type of data provided (e.g., categorical, ordinal, quantitative)
2.4 determine, by performing a linear regression using technology, the equation of a line that models a suitable two-variable data set, deter- mine the fit of an individual data point to the linear model (e.g., by using residuals to iden- tify outliers), and recognize these processes
as strategies for two-variable data analysis
2.5 interpret statistical summaries (e.g., scatter plot, equation representing a relationship)
to describe the characteristics of a two- variable data set and to compare two related two-variable data sets (e.g., compare the relationship between Grade 12 English and mathematics marks with the relationship between Grade 12 science and mathematics marks); describe how statistical summaries (e.g., graphs, linear models) can be used to misrepresent two-variable data; and make inferences, and make and justify conclusions, from statistical summaries of two-variable data orally and in writing, using convincing arguments
3. Evaluating Validity
By the end of this course, students will:
3.1 interpret statistics presented in the media (e.g., the UN’s finding that 2% of the world’s population has more than half the world’s wealth, whereas half the world’s population has only 1% of the world’s wealth), and explain how the media, the advertising indus- try, and others (e.g., marketers, pollsters) use and misuse statistics (e.g., as represented in graphs) to promote a certain point of view (e.g., by making a general statement based on a weak correlation or an assumed cause-and- effect relationship; by starting the vertical scale at a value other than zero; by making statements using general population statistics without reference to data specific to minority groups)
3.2 assess the validity of conclusions presented
in the media by examining sources of data, including Internet sources (i.e., to determine whether they are authoritative, reliable, unbiased, and current), methods of data collection, and possible sources of bias (e.g., sampling bias, non-response bias, cultural bias in a survey question), and by questioning the analysis of the data (e.g., whether there is any indication of the sample size in the analysis) and conclusions drawn from the data (e.g., whether any assumptions are made about cause and effect)
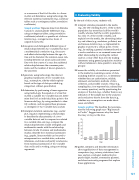
Sample problem: The headline that accompa- nies the following graph says “Big Increase in Profits”. Suggest reasons why this head- line may or may not be true.
Profits ($ billions)
23 22 21 20 19 18
17 2001
2002 2003 2004
2005 2006 2007
Year
3.3 gather, interpret, and describe information about applications of data management in occupations (e.g., actuary, statistician, busi- ness analyst, sociologist, medical doctor, psychologist, teacher, community planner), and about university programs that explore these applications
STATISTICAL ANALYSIS
121
M a t h e m a t i c s Fo uf nD ca t t i a o Mn as n a g e m e n t
MDM4U
